
On this page
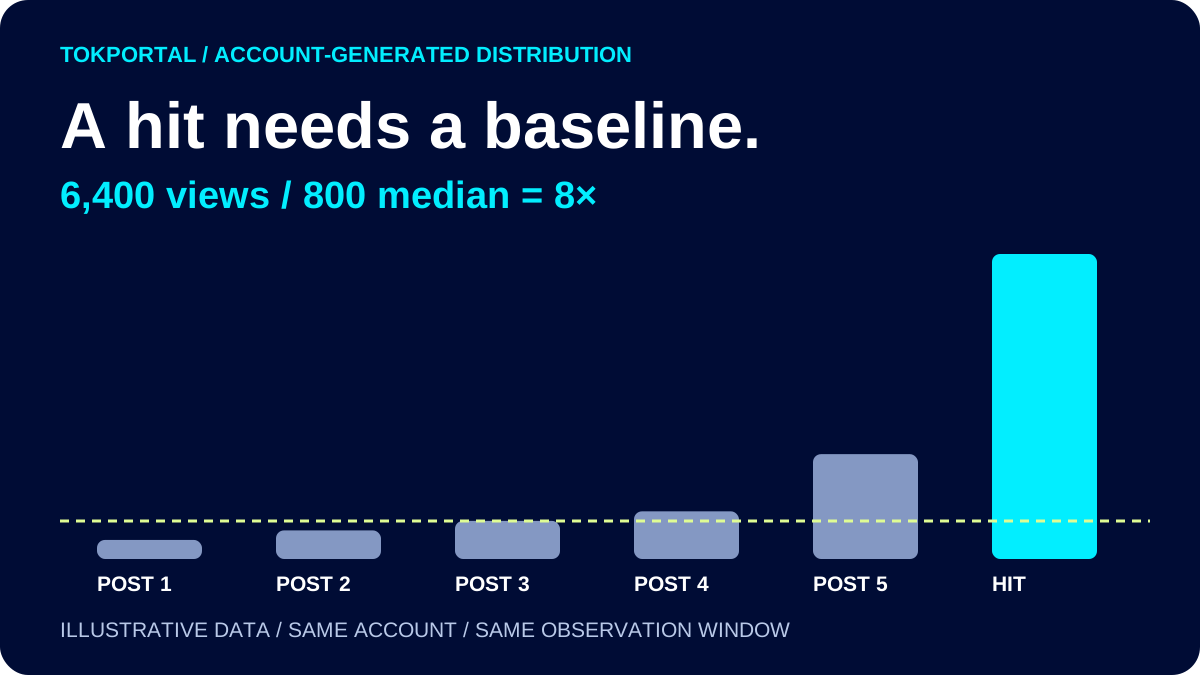
One account gets 800 views on a typical post and suddenly reaches 6,400. Another normally gets 80,000 and reaches 90,000. The larger number wins a screenshot contest. The smaller account may have the more interesting change to investigate.
In Account-Generated Distribution (AGD), a viral hit is a post with an unusually high result relative to its normal context. It can be interesting within a small account, a niche or one format. There is no universal view count in this definition. Compare the account, the job of the post and the time available to accumulate views before deciding what the result means.
The practical sequence is to identify the candidate, build a fair baseline, inspect the creative, look at the downstream behaviour and choose the next execution. A useful AGD review should end with something the creative team can make or change.
Sources & real examples
Public accounts, original posts and primary references. Each example is linked where it is discussed.
View all 7 sources and review notes
- NIST: measures of location ↗
Statistical reference for the median, skewed distributions and the figure reproduced below.
- TikTok: tools for creators ↗
Where to find account and post analytics in TikTok Studio; available metrics vary by experience.
- TikTok: how recommendations work ↗
Context for why distribution differs across viewers and posts.
- One account getting more views than the other ↗
Public creator self-report, useful for framing the measurement problem.
- Zach King: public Shorts counts ↗
Dated feed snapshot used to explain why unmatched public counts are not a reliable baseline.
- Zach King: original Lego Short ↗
A specific creative research reference; no private analytics available.
- Fifteen Seconds of Fame (2022) ↗
Open-access primary research. Historical political-account sample; Figure 5 reports peak-to-median ratios.
A real creator question: why does one account get more views?
In this public discussion, a creator reports that an established account usually receives about 300 views, sometimes reaching 600 to 1,000 after several days, while a new account reaches 700 to 1,000 the same day. They say they used the same content and caption. The natural question is whether the new account is simply “better.” The evidence supplied does not settle that question.
First, the observation windows differ. “The same day” and “after several days” are not a consistent age for comparison. Second, we do not have a complete list of posts, their publication times or their individual counts. Third, identical captions do not hold every aspect of distribution constant. The post is a useful starting point for a measurement plan, not proof that a new account receives a special boost.
An AGD operator should turn this question into a small ledger. Record each original post URL, its account, publication time, measurement time and views. Keep the accounts separate when calculating their baselines. Then inspect the creative and the account role. The goal is to decide what to produce next with better evidence, rather than turn one unexplained difference into a rule for every account in the network.
A public feed is a research lead, not a ready-made baseline
The visible Zach King feed makes the problem easy to see. Individual counts differ substantially, but the screenshot does not provide matched observation windows, historical snapshots or private analytics. Dividing the largest visible number by the median of this conveniently cropped row would create a precise-looking ratio from an opportunistic sample.
You can still use the feed well. Open a specific example such as the Lego Short, record its premise and add it to a creative research board. Treat the public count as a dated observation. If you are reviewing an account you operate, use your own consistently collected post history for the performance comparison. Keep “interesting creative reference” and “measured relative hit” as separate fields in the review.
Collect the observation before explaining it
Open TikTok Studio and inspect the account and individual-post metrics available to you. TikTok’s help page describes key metrics, content analytics and follower information, with differences between the app and web experiences. Keep a post URL alongside every observation so the creative can be inspected with the numbers.
Record the publication time and the measurement time. “6,400 views” is incomplete if one post has had three hours and another has had three weeks. Capture the format, the account role and any known extra distribution, such as paid promotion or a large external share. Missing information should remain missing rather than being silently replaced with zero.
Choose the comparison window before ranking the posts. For example, you might inspect a set at seventy-two hours if that age fits your review cadence. This is a practical observation window, not an algorithm rule. Use another window when it better suits your content, but apply it consistently within the comparison.
Compare like with like
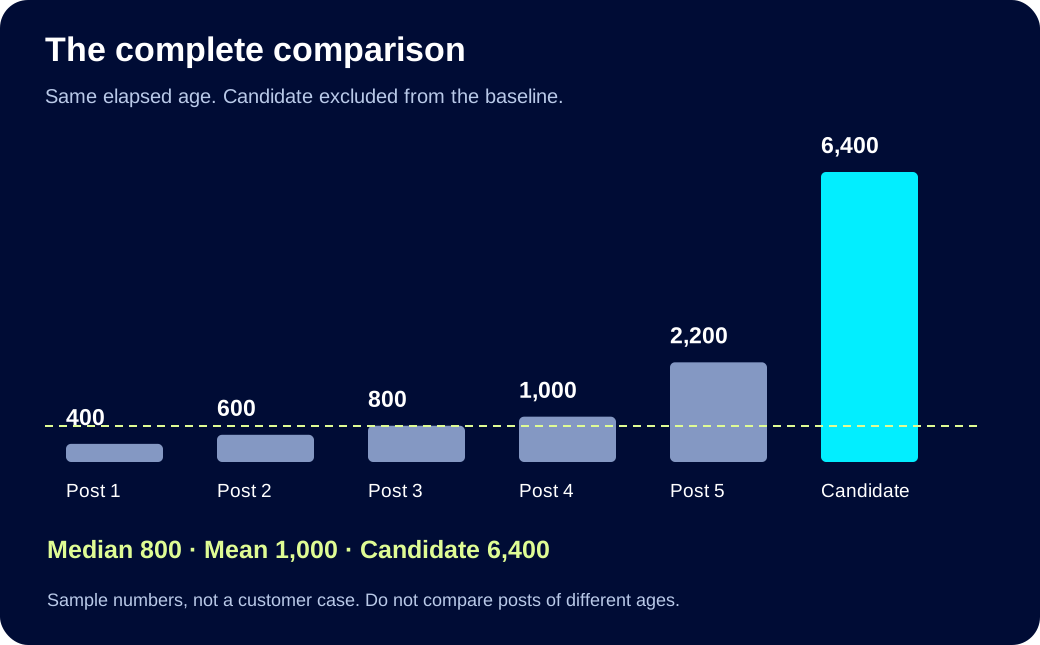
Take a set of recent, comparable posts from the same account. Record views at the same elapsed age, such as seventy-two hours after publication. Sort the counts and calculate the median: the middle value, or the average of the two middle values when the set has an even length. Keep the candidate post out of its own baseline.
For a worked example, use comparison counts of 400, 600, 800, 1,000 and 2,200. Their median is 800. A candidate with 6,400 views has eight times that median. These are illustrative numbers chosen to show the calculation, not a TokPortal customer result.
Try your own numbers
How unusual is this post for this account?
8× the comparison median
Example defaults, not TokPortal results. Compare the same account, format and elapsed time since publication. A ratio measures relative performance; it does not establish statistical significance, sales or a platform-defined viral threshold.
Read the worked example as a small dataset
The five comparison posts have 400, 600, 800, 1,000 and 2,200 views at the same elapsed age. Their total is 5,000 and their mean is 1,000. Their median is 800. A candidate with 6,400 views is therefore 8× the median and 6.4× the mean. Both calculations describe the same example; they answer slightly different questions about what counts as typical.
The large comparison post is worth inspecting too. Does it share the candidate’s subject, opening or format? If so, the candidate may be part of an emerging series rather than an isolated event. If it received a special external share, that context should travel with the record. The ratio helps you choose what to investigate; the post and its history help you understand it.
Why the median is useful, and what it misses
NIST’s measures-of-location reference explains why extreme observations can pull the mean while the median depends on rank. The figure makes that distinction visible. It does not establish that social views follow any one of these distributions. Keep the full comparison counts available rather than treating a median as a complete description of the feed.
The median is less influenced by one unusually large post than the mean. That makes it a useful starting point when reviewing an uneven feed. It still hides variation, sample size and changes in audience. Keep the comparison counts alongside the ratio so an editor can see what the baseline actually contains.
A new account with only two posts does not have a stable baseline. A median of zero makes this ratio undefined, not infinite proof of success. If the account has changed its topic, language or format, explain the change before comparing old and new posts. A ratio is a descriptive tool, not a significance test.
Research has measured peak-to-median views, with a specific scope
Guinaudeau, Munger and Votta’s 2022 study compared political video accounts on TikTok and YouTube. Its Figure 5 reports median peak-to-median view ratios of 64 and 40 respectively. The TikTok collection covered nearly two million videos from 11,546 accounts, gathered by October 2020. This is historical, sampled political-content research. It does not define a current threshold for a brand’s viral hit.
The study compares an account’s most-viewed video with its median video. Our planning example compares a candidate with a chosen set of comparable posts at a consistent age. The calculations answer related but different questions. Neither result establishes that copying a winning video will reproduce its performance. Use the paper as evidence that within-account variation is worth examining, while preserving the limits of its population and measurement.
Three situations where the ratio can mislead you
A tiny or empty baseline. If the comparison median is zero, division is undefined. If you have only two comparable posts, one additional post can change the story substantially. Show the observations and continue collecting rather than giving the account a confident viral score.
A changed account. A switch in language, audience promise or recurring format can make last month’s posts a poor baseline. Separate the periods and explain the decision. Do not select only weak past posts to make the current result look impressive.
Unequal treatment. A boosted video, a collaboration and an ordinary post have different distribution histories. Record that difference before comparing them. A larger count after extra promotion is a real observation, but it is not evidence that the creative alone produced the increase.
Inspect the mechanism, not just the first two seconds
Watch the post once as a viewer and once as an editor. On the first pass, write down what made you keep watching. On the second, identify the opening promise, the material used to deliver it, the moment of payoff and the role of the product. Read relevant comments for clues about what viewers actually noticed.
Suppose the candidate is a short demonstration of a confusing app feature. Your working explanation might be that the screen recording makes the benefit obvious. A good follow-up demonstrates a different feature through a similarly clear problem and resolution. A weak follow-up copies the original video and changes the opening caption.
Write at least one alternative explanation. Perhaps the topic was timely, a larger account shared the post, or the comment discussion attracted attention. You do not need to resolve everything before making another good video, but you should know which explanation the next execution is exploring.
Turn the hit into a creative brief
Viral hit review
CANDIDATE
Post URL:
Account:
Format:
Published at (UTC):
Measured at (UTC):
Views at comparable age:

BASELINE
Comparison post URLs and view counts:
Same format and elapsed age?
Median (excluding candidate):
Candidate / median:

WHAT MIGHT EXPLAIN IT?
Opening promise:
Topic or tension:
Specific example:
Payoff:
Audience response:
Other distribution or promotion:

NEXT ORIGINAL EXECUTION
What stays?
What changes?
What observation would weaken our explanation?
Keep the mechanism you want to investigate. If the hit explained a common beginner mistake, choose another real mistake and make a new demonstration. If its strength was a recognizable situation, write a different situation. Copying the full post across the network gives you more copies, not a better explanation of why it worked.
Do not turn a distribution spike into a revenue claim
Compare saves, useful comments, profile visits and downstream actions where those metrics are available. Each answers a different question. A post can be widely entertaining without attracting buyers. A quieter post can be useful to a narrow audience that needs the product.
TikTok describes personalized ranking using several kinds of signals. That does not make each account or post an independent experimental trial. In an AGD network, shared ideas and overlapping audiences can connect the outcomes. Treat the comparison as operational learning unless you have a design that supports a stronger conclusion.
Record observed visits and purchases separately. When linking content to a purchase, distinguish a measured path from a causal claim, and do not count the same buyer once per post. Then decide whether to make a new execution, improve the destination or stop exploring that angle.
Choose one of four next actions
Develop the creative. Make a new example of the useful mechanism. Preserve what you think helped, but supply new material and a distinct payoff. Assign it to the account whose editorial promise it serves.
Repair the destination. If relevant viewers arrive but the next step is confusing, inspect the landing page or signup path. The strongest opening in the world cannot explain a product page that fails to say what the buyer gets.
Change the account role. If the strongest posts repeatedly serve a different audience from the profile promise, revisit the brief. A few broad jokes should not automatically turn a detailed tutorial account into a generic meme feed.
Stop pursuing the angle. A spectacular post can be a poor fit for the product or the team’s skills. Keep the record and use the capacity elsewhere. The purpose of measurement is to make better decisions, including a decision not to repeat something.
Maintain a ledger across the AGD network
Give each publication one stable record that connects the account, creative concept, final asset, published URL and measurement timestamps. Store the explanation and next action alongside that record. When a new editor joins, they should be able to trace why a follow-up exists instead of inheriting a folder called “viral winners.”
Track observed visits, signups and purchases separately when the available analytics supports that path. Deduplicate buyers across posts and distinguish a new buyer from a returning customer. An unattributed purchase is not proof for whichever video happens to have the most views that week.
TokPortal can coordinate the managed account and publishing work through its dashboard, API or MCP. The ledger still needs a clear measurement window and accurate post identity. Use the AGD planner when the next decision changes account capacity or creative supply; do not turn an observed view ratio into a promised reach forecast.
What should I post after a viral video?
Start with the audience need the post fulfilled. If people responded to a demonstration, find another genuine problem that deserves the same clarity. If they responded to a surprising scene, develop a new scene with a distinct payoff. If they came for an answer, inspect their follow-up questions before making a sequel. Your next post should give a returning viewer another reason to stay.
Keep the decision small enough to learn from. Write the mechanism you are preserving, the material you are changing and the account that should publish it. Compare the follow-up with that account’s ordinary work at the same elapsed age. It may perform below the original spike and still be useful. A record-breaking post is a selected extreme; treating every later post as a failure because it is smaller makes the review less informative.
In a network, do not send the same follow-up to every account automatically. One account may be suited to a practical explanation, another to a character-driven scene. Translate the lesson into each account’s editorial role and make a new execution. That is where the AGD measurement loop reconnects with account and content isolation: learning can travel across the network without every asset becoming interchangeable.
Make the next batch worth measuring
A useful AGD review ends with a specific production decision: three new examples of the winning mechanism, a revised account role, or a better product explanation. Pair this review with the content isolation worksheet. The objective is to develop a repeatable editorial skill, not to rename every lucky post a strategy.

Written by
Vincent Tellenne
Co-founder & CEO
Vincent is a co-founder and CEO of TokPortal. He works on the infrastructure and operating model behind scaled organic social media distribution.
Learn more about this topic with AI
Related Resources
Related Tools
Put your AGD strategy to work
You make the content.
TokPortal runs the account operations.
Create and operate TikTok and Instagram accounts in your target market. Local operators handle the account work and native publishing. You control the brief, content and campaign from the dashboard, API or MCP.
- 01Choose your market
- 02Define each account
- 03Schedule your content
Review market availability and pricing before ordering. No reach forecast is built into your plan.