Virality on TikTok is rarely random. It is usually the result of a few measurable signals that tell the algorithm, and real people, “this video is worth more distribution.” The faster you can spot those signals, the faster you can double down on winners, kill losers, and turn “we post a lot” into “we grow predictably.”
This guide breaks down TikTok user analytics that best predict your next viral, what to watch in the first hours, and how to operationalize this across accounts and countries.
What “viral” actually means in TikTok analytics
Marketers often define viral as “a lot of views.” TikTok defines it more like “a video that earns progressively larger test audiences because it keeps people watching and sharing.”
In practice, a video typically moves through waves:
- Initial distribution to a small audience (often a mix of followers and non-followers)
- Scaling tests to larger audiences if performance holds
- Stabilization or breakout depending on whether key ratios stay strong as reach expands
Your job is not to guess. Your job is to track the handful of metrics that tend to stay predictive as those waves get bigger.
The 4 metric families that predict virality
Think of TikTok’s recommendation system as optimizing for viewer satisfaction at scale. Your analytics are the only window into that.
1) Retention metrics (the strongest leading indicators)
If you only track one family of metrics, track retention. Retention is the closest thing to “content-market fit” on TikTok.
Key retention metrics:
- Average watch time: How long the average viewer watches.
- Average percentage watched: Watch time relative to video length.
- Completion rate: Percentage of viewers who watch to the end.
- Rewatches / loops: Indirectly seen when average watch time exceeds video length, or when retention curves spike near the end.
Why it predicts virality: retention scales. Likes can be cheap, but sustained watch time across broader audiences is hard to fake.
Practical interpretation:
- Short videos (7 to 15s) often need very high completion to break out.
- Longer videos (30 to 60s+) can go viral with lower completion, but they still need strong average percentage watched and a non-collapsing retention curve.
If you have to choose between “more engaging” and “more informative,” on TikTok the winner is usually “more watchable.” You can still be informative, but you need to package it in a way that keeps the TikTok user watching.

2) Share and save rate (the strongest scaling signals)
Once retention is solid, shares and saves tend to be the accelerants that turn a good post into a breakout.
- Shares per view: “This is worth sending to someone.”
- Saves per view: “This is worth coming back to.”
Why it predicts virality: both behaviors signal high value and future watch intent, and they often correlate with distribution beyond the initial test bubble.
What to do with this insight:
- Educational or tactical content should be engineered for saves (checklists, scripts, templates, “do this, not that”).
- Culture, humor, and strong opinions are often engineered for shares (relatable moments, debate hooks, “send this to your friend who…” framing).
3) Engagement depth (comments that matter)
Not all engagement is equal. A like is lightweight. A meaningful comment is not.
Track:
- Comments per view (not just total comments)
- Comment quality (questions, disagreement, tagging friends, “where do I get this?”, “can you do one for X?”)
- New follower rate per view (more on this below)
Why it predicts virality: comments are often a proxy for cognitive and emotional intensity. They also create additional session time as viewers read threads.
A quick heuristic: a post with average retention but unusually high comment depth can still break out, especially in controversial or high-stakes niches (finance, career, health, politics, B2B “hot takes”).
4) Conversion and intent metrics (predict business winners, not just view winners)
If you run TikTok for growth, the real question is: “Will this go viral AND drive outcomes?”
Track:
- Profile visits per view: Does the video create curiosity?
- Follows per view: Does it convert attention into future distribution?
- Link clicks / conversion events (if applicable): Does it move users into your funnel?
These metrics often lag by hours or days, but they are essential for deciding what formats deserve more production budget.
The “early window” dashboard: what to check in the first 30 to 120 minutes
For most accounts, the most actionable decisions happen early. Not because the video is “done,” but because you need a system for:
- spotting winners fast
- creating variants fast
- distributing those variants across accounts and geos fast
Here is a practical early-window checklist. Use it as a simple, repeatable routine.
First checkpoint: retention vs. length
Ask:
- Is average percentage watched strong relative to this video length?
- Is completion holding, or is the retention curve collapsing in the first seconds?
If retention is weak early, the fix is almost never “add hashtags.” It is usually:
- a stronger first 1 to 2 seconds (clear premise, tension, novelty)
- tighter editing (remove setup, keep payoff)
- better on-screen text (make the promise unmissable)
Second checkpoint: shares and saves per view
Ask:
- Are people saving it like a reference?
- Are they sharing it like a social object?
If retention is good but shares and saves are low, you probably have a “watchable” video that is not “useful” or “sendable.” Add:
- a concrete takeaway
- a punchline
- a polarizing but defensible point
- a clear audience callout (“If you do X, do this instead”)
Third checkpoint: non-follower reach and follower conversion
Ask:
- Is the video reaching non-followers?
- Are non-followers converting to followers?
A common pattern in accounts that plateau: decent views, weak follow conversion. That usually means the content is entertaining but not positionally clear.
Fix it with:
- consistent series packaging (“Part 1 of 10: …”)
- sharper niche signaling in the first seconds
- a clearer reason to follow (“I test X every week so you don’t waste money”)
A practical “virality score” you can use without overfitting
You do not need a complex model. You need a ranking system that helps you decide what to replicate.
Start with a simple weighted view:
- Retention: primary
- Shares + saves: secondary accelerants
- Comments + follows: validation and compounding
Operational rule of thumb:
- If a post is top 20% on retention in the first hour, it deserves a variant.
- If it is top 20% on shares or saves per view, it deserves cross-posting and localization.
The exact thresholds vary by niche and account size, so compare videos to your own baseline. The most dangerous mistake is comparing your early-stage account to a creator with 5 million followers.
The most overlooked predictor: audience-geo match
If you are trying to reach US users from abroad (or any market mismatch), analytics can look “mysteriously bad” even when the creative is good.
Why: TikTok distribution is heavily influenced by location signals. If the account’s “home” context does not match the audience you want, you often get:
- lower initial test performance
- weaker comment relevance (wrong language, wrong cultural references)
- lower share intent (people share what feels native)
This is why global brands increasingly run separate local accounts rather than one global account.
If you want the deeper mechanics of this problem, TokPortal has a solid primer on why localization matters for international growth.
How to turn analytics into a repeatable viral pipeline (the workflow)
Virality becomes predictable when you treat TikTok like a testing lab.
Step 1: Define 3 to 5 repeatable “formats,” not infinite one-offs
Formats are containers you can iterate quickly. Examples:
- “3 mistakes” teardown
- “POV: you are doing X wrong”
- founder story with a twist at second 2
- street interview style Q and A
- before/after with a single measurable claim
Analytics becomes much more predictive when you compare apples to apples.
Step 2: Build variants, not edits
A variant changes one variable. Examples:
- Hook variant: same body, different first 2 seconds
- Caption variant: same video, different on-screen text promise
- CTA variant: save-focused vs share-focused framing
This is how you learn what actually drives retention and sharing, instead of guessing.
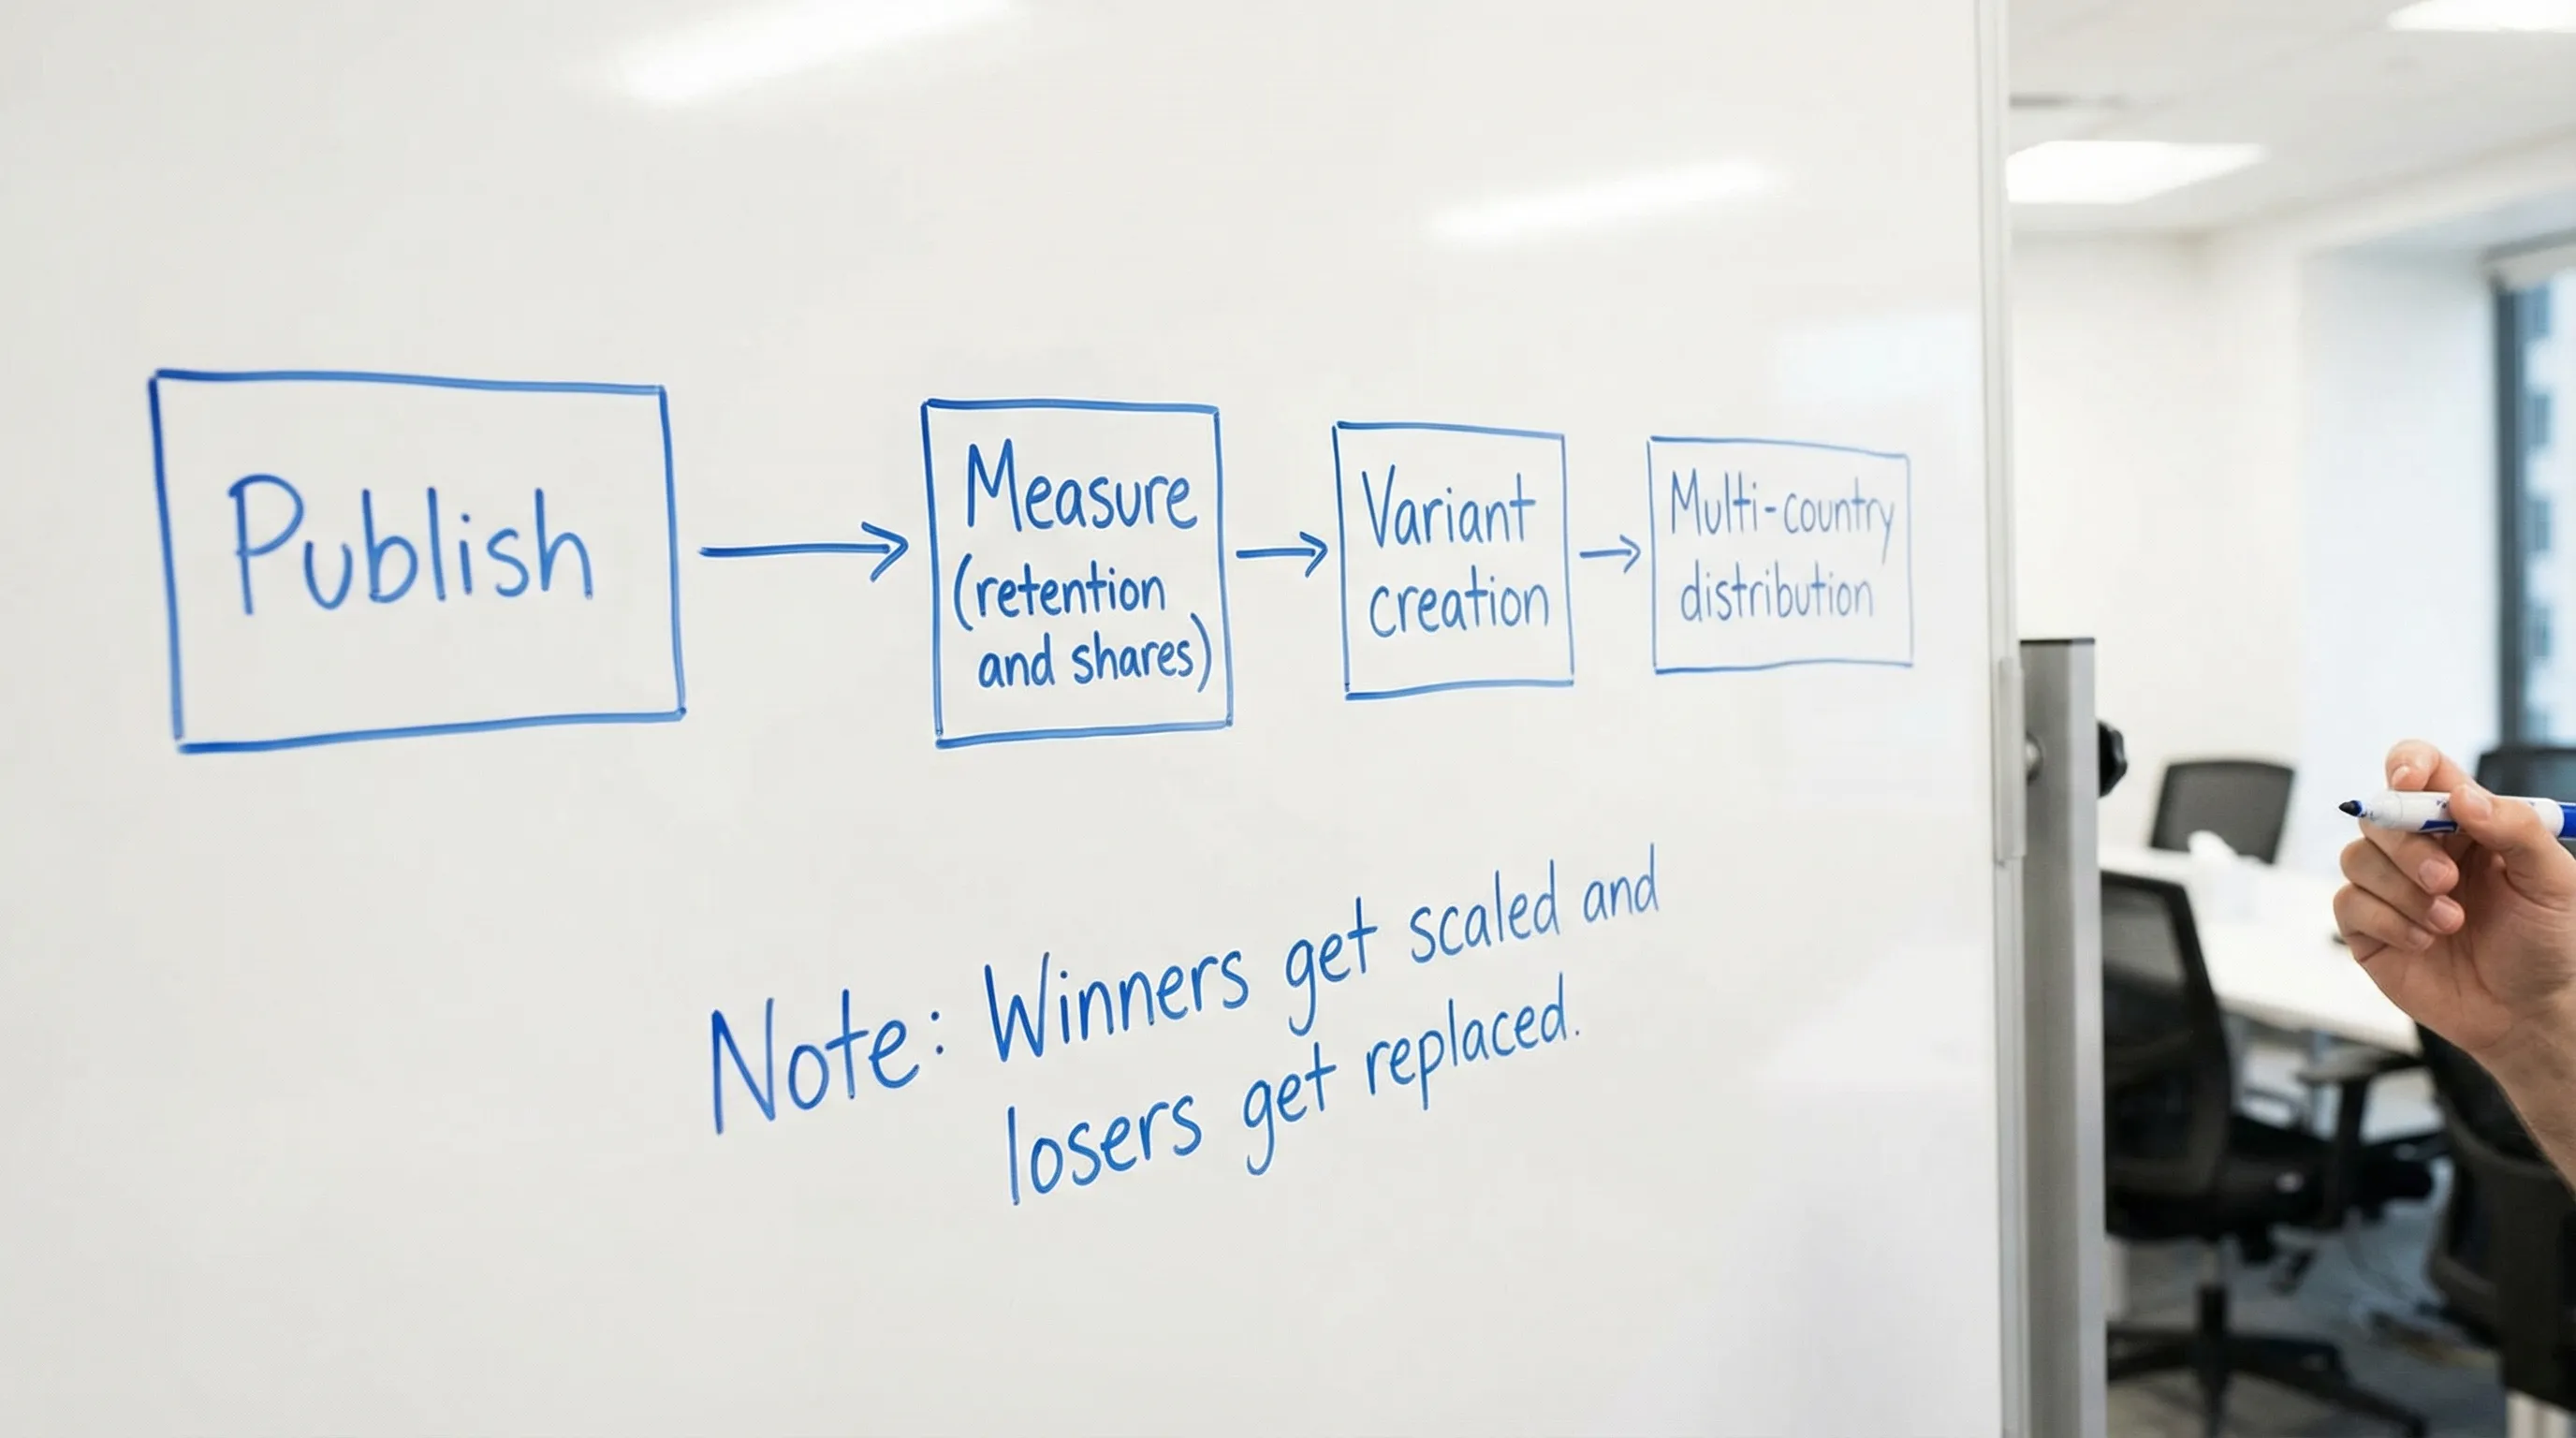
Step 3: Scale winners across geos and accounts (without operational chaos)
The moment a post shows strong leading indicators, the highest-leverage move is often to test it in other markets.
That is where most teams break:
- too many logins
- too many time zones
- inconsistent posting cadence
- no unified analytics view
TokPortal is designed for that scaling layer, with geo-verified accounts, scheduling by time zone, and analytics per account and country. If your strategy includes multi-market testing, start with the Quick Guide to see the workflow.
Metric-by-metric: what to improve when a video underperforms
Use this as a diagnostic map. One problem, one primary fix.
If average watch time is low
Likely causes:
- Hook is unclear or too slow
- Video has too much setup
- The promise is not delivered quickly
High-impact fixes:
- Put the outcome first, then explain
- Cut the first 1 to 3 seconds of “politeness”
- Add on-screen text that states the payoff concretely
If completion is low but watch time is decent
Likely causes:
- Middle is interesting, ending is weak
- Viewers feel they already got the value
High-impact fixes:
- Add an “open loop” early (“At the end I’ll show the template”) and actually deliver
- Make the ending a new piece of information, not a recap
If shares are low
Likely causes:
- Content is informative but not socially useful
- No clear “send this to…” angle
High-impact fixes:
- Add a relatable audience callout
- Make the point more specific or more controversial (without becoming misleading)
If saves are low
Likely causes:
- Content is entertaining but not reusable
- Takeaway is not structured
High-impact fixes:
- Turn insights into a checklist or script
- Add “bookmark this” framing only when it is genuinely save-worthy
If follows per view are low
Likely causes:
- The video has no clear niche identity
- The profile does not promise consistent future value
High-impact fixes:
- Convert one-off posts into series
- Align your bio and pinned posts with the content promise
How agencies and growth teams should read analytics differently
For agencies
Your job is not just to make a video go viral. It is to build a system that can produce repeatable winners across clients and markets.
Focus on:
- format-level benchmarks (what “good retention” looks like for each format)
- country-level benchmarks (what “good shares per view” looks like in the US vs UK vs FR)
- operational speed (how quickly you can publish variants)
If you manage dozens of accounts, centralizing posting and analytics becomes a performance advantage, not just a convenience. This is the core “infrastructure” layer TokPortal is built for.
For app founders and SaaS teams
You should track two parallel scoreboards:
- virality predictors (retention, shares, saves)
- conversion predictors (profile visits, link clicks, sign-ups)
A video can be a “view winner” and a “revenue loser.” Your analytics should tell you which is which.
For music labels and artists
In addition to retention, watch:
- sound usage lift (are people using the sound after the post?)
- geo response (which markets comment, share, and create?)
A track often breaks locally before it breaks globally. Multi-market testing helps you find the first spark and then export it.
Where TokPortal fits in an analytics-driven viral strategy
If your goal is one account, in one country, posting occasionally, you can do a lot with native TikTok analytics.
TokPortal becomes relevant when your strategy looks like:
- testing the same creative across multiple countries
- running 10 to 50+ accounts for clients, brands, or products
- scheduling at local prime times without manual time zone math
- tracking performance per account and country from one place
If that is you, start at the TokPortal homepage to see the platform positioning, then check Pricing for scale options. When you are ready to set up, you can Sign Up.
The simplest way to predict your next viral: compare against your own baselines
There is no universal “viral threshold.” There is a universal process:
- Define a small set of formats
- Track retention, shares, saves, and follow conversion per format
- Ship variants fast
- Scale winners across accounts and markets
Do that consistently and TikTok stops feeling like a lottery. It starts behaving like a growth channel with measurable leading indicators.
If you want to operationalize this across countries without VPN risk or account chaos, TokPortal’s Quick Guide is the fastest place to start.


 Any question? Contact us.